Current Data
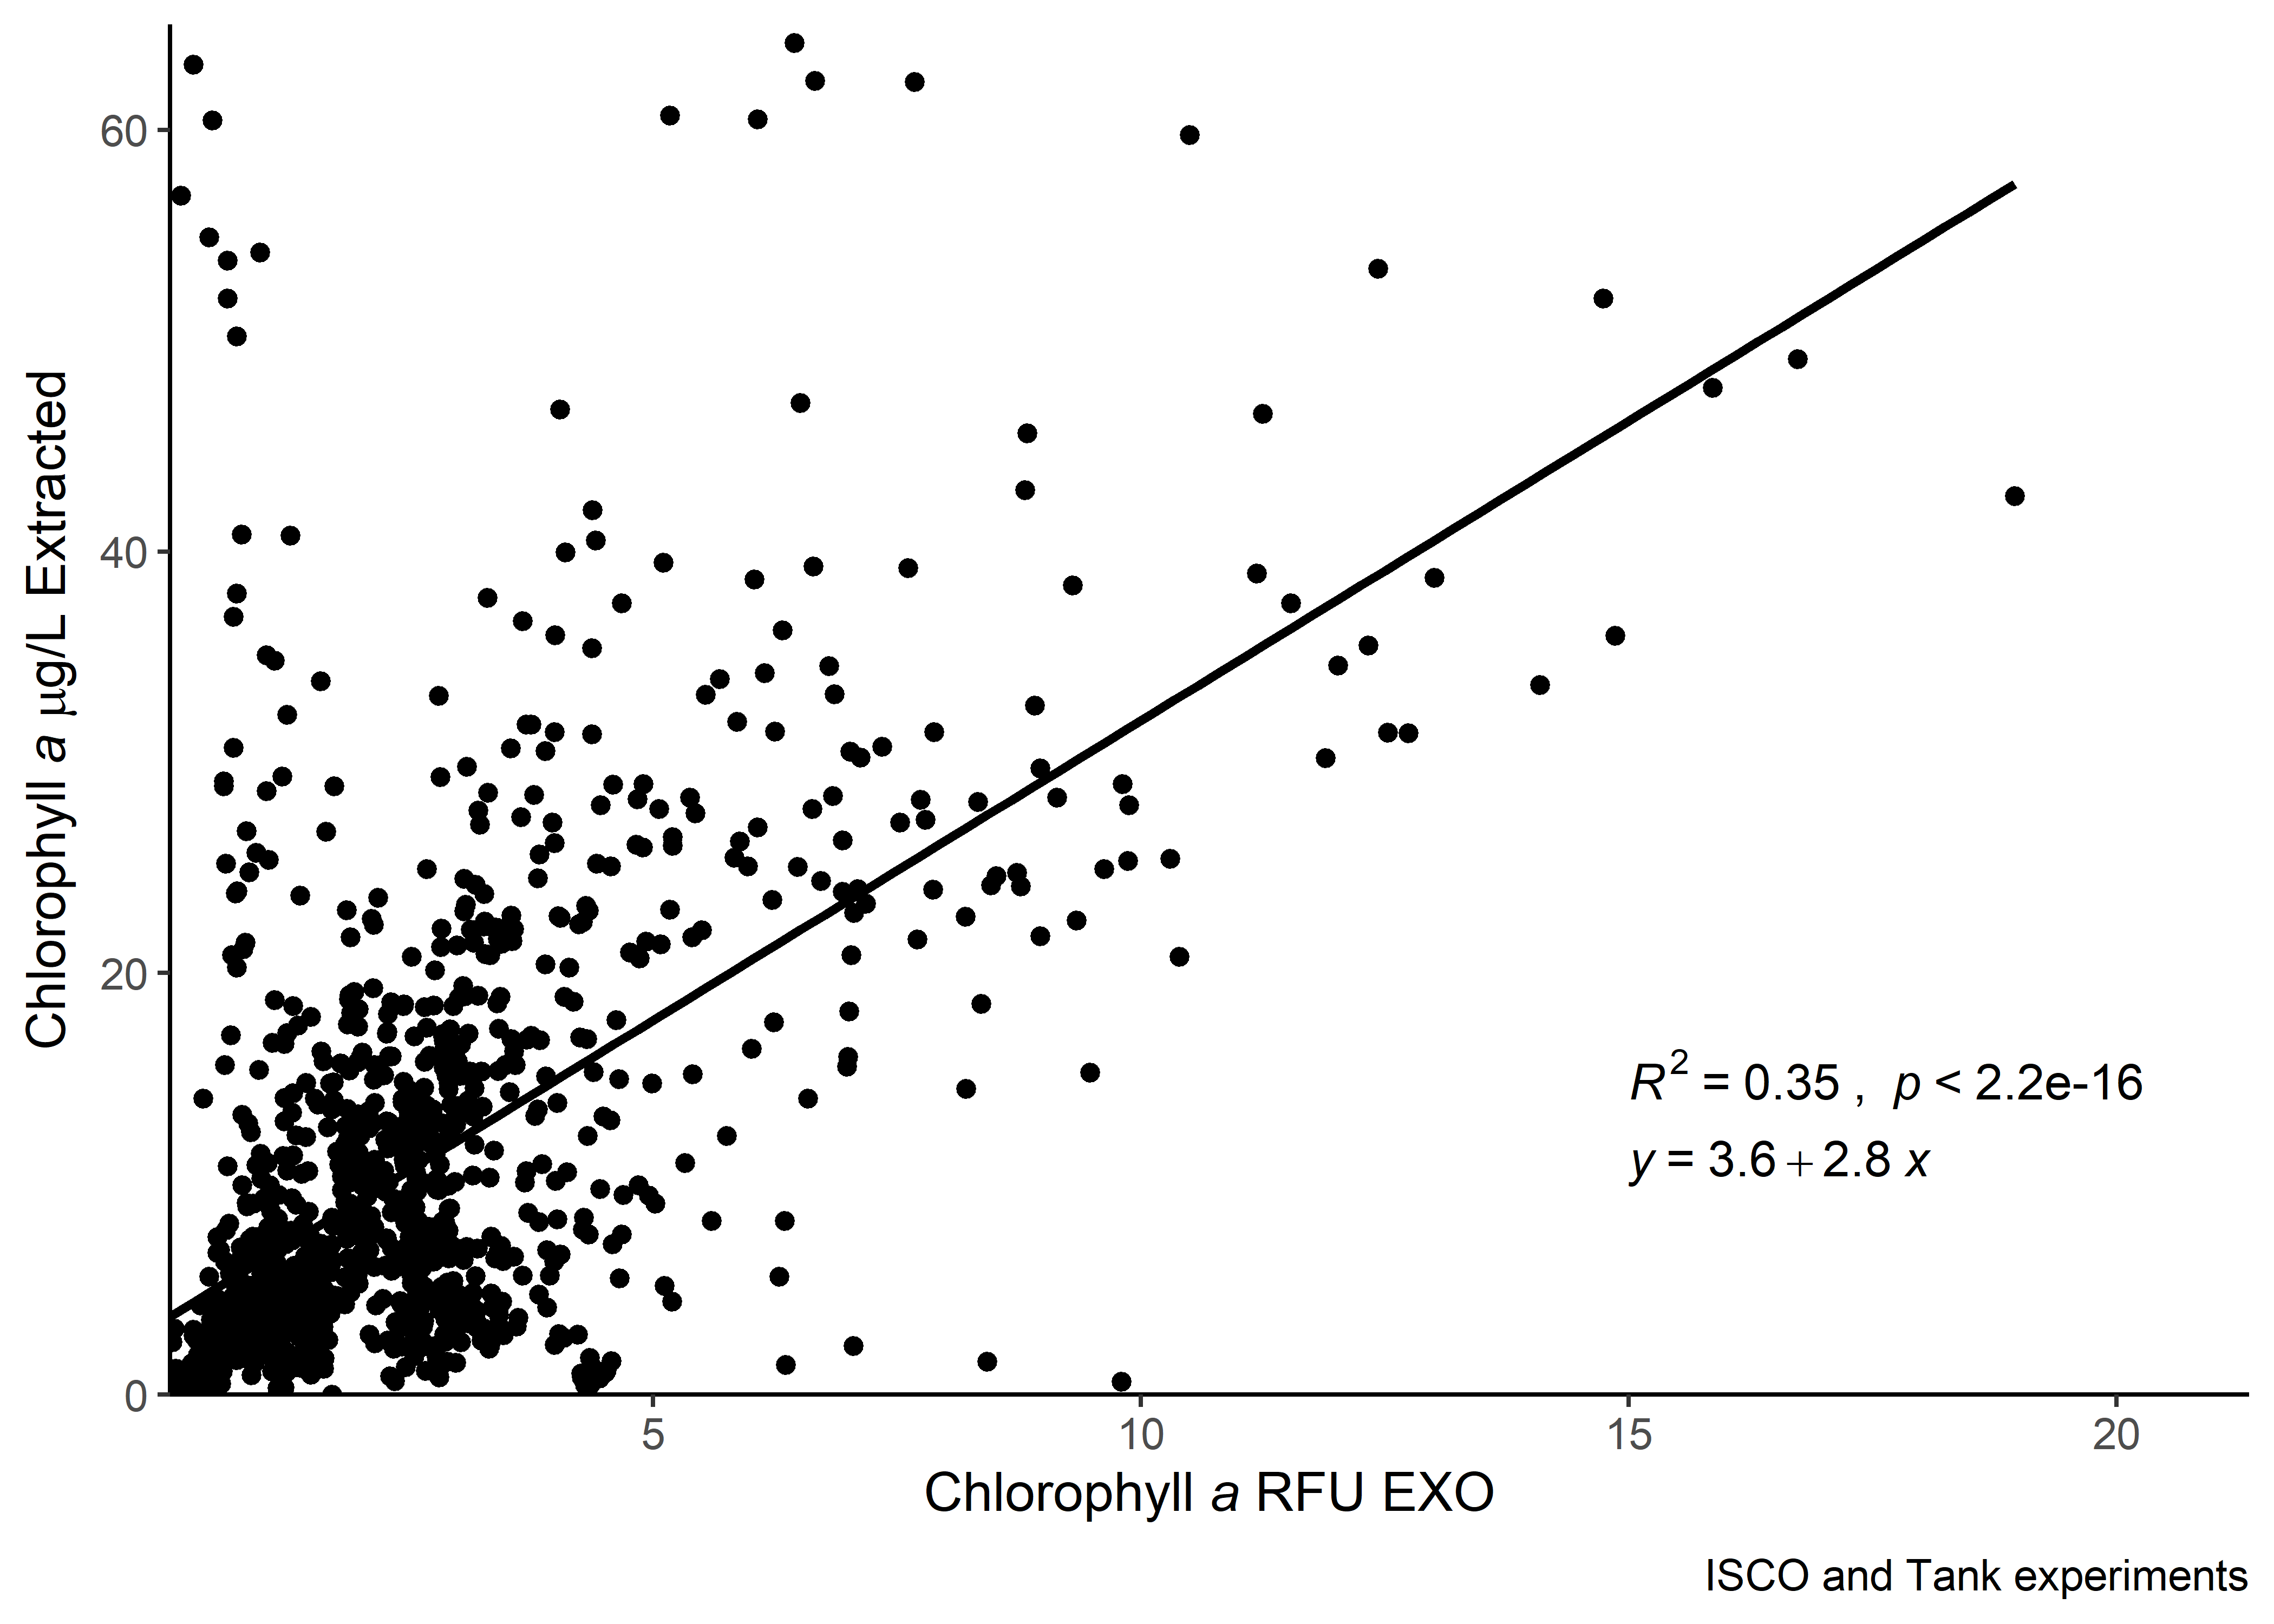
Contains all data from both ISCO and tank collection methods from all reserves that submitted data.
TAL Sensor CHLA (RFU) vs. Extracted CHLA (\(\mu\)g/L)
All
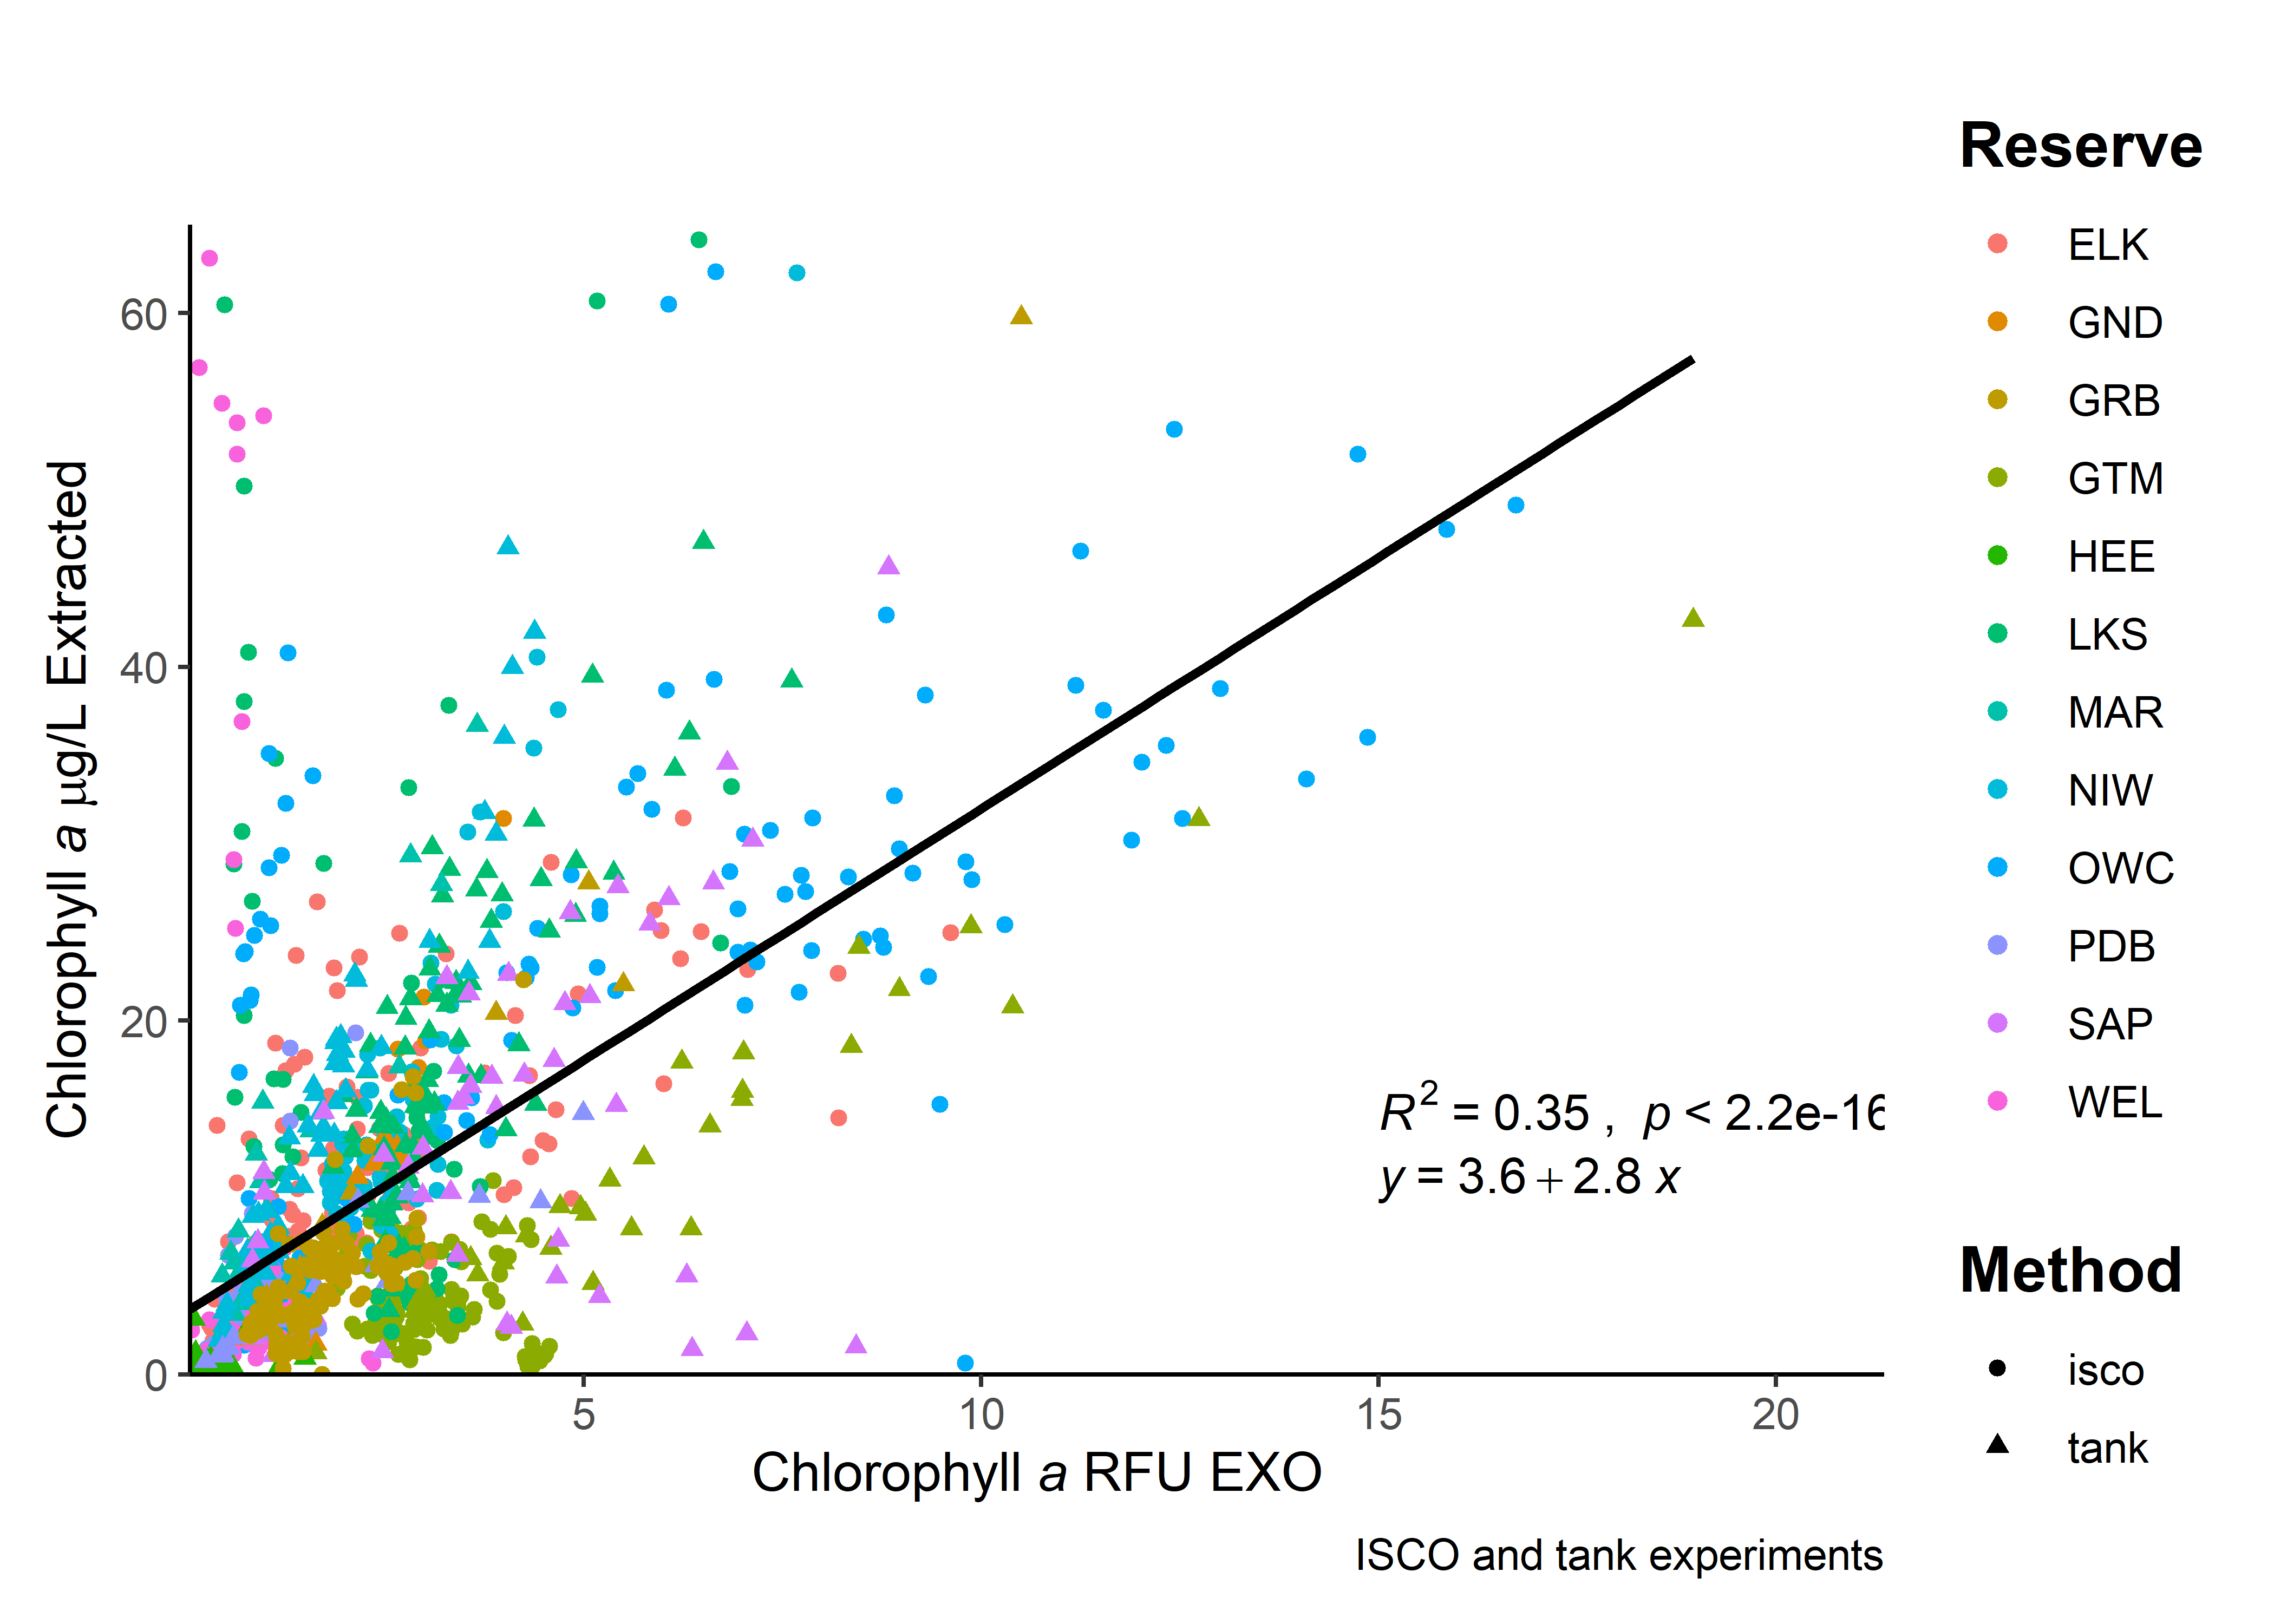
Reserve and Methods
Current Data with reserves and the methods pulled out.
Reserve and Methods (Interactive)
How to use the interactive plot: Hover over interactive plot for the tools panel to appear in top-right corner. Tools include: save plot, zoom, select (lasso or box), and data compare. Hover your cursor over a point for more information. You can also double click on an item in the legend to isolate that data series in the plot!
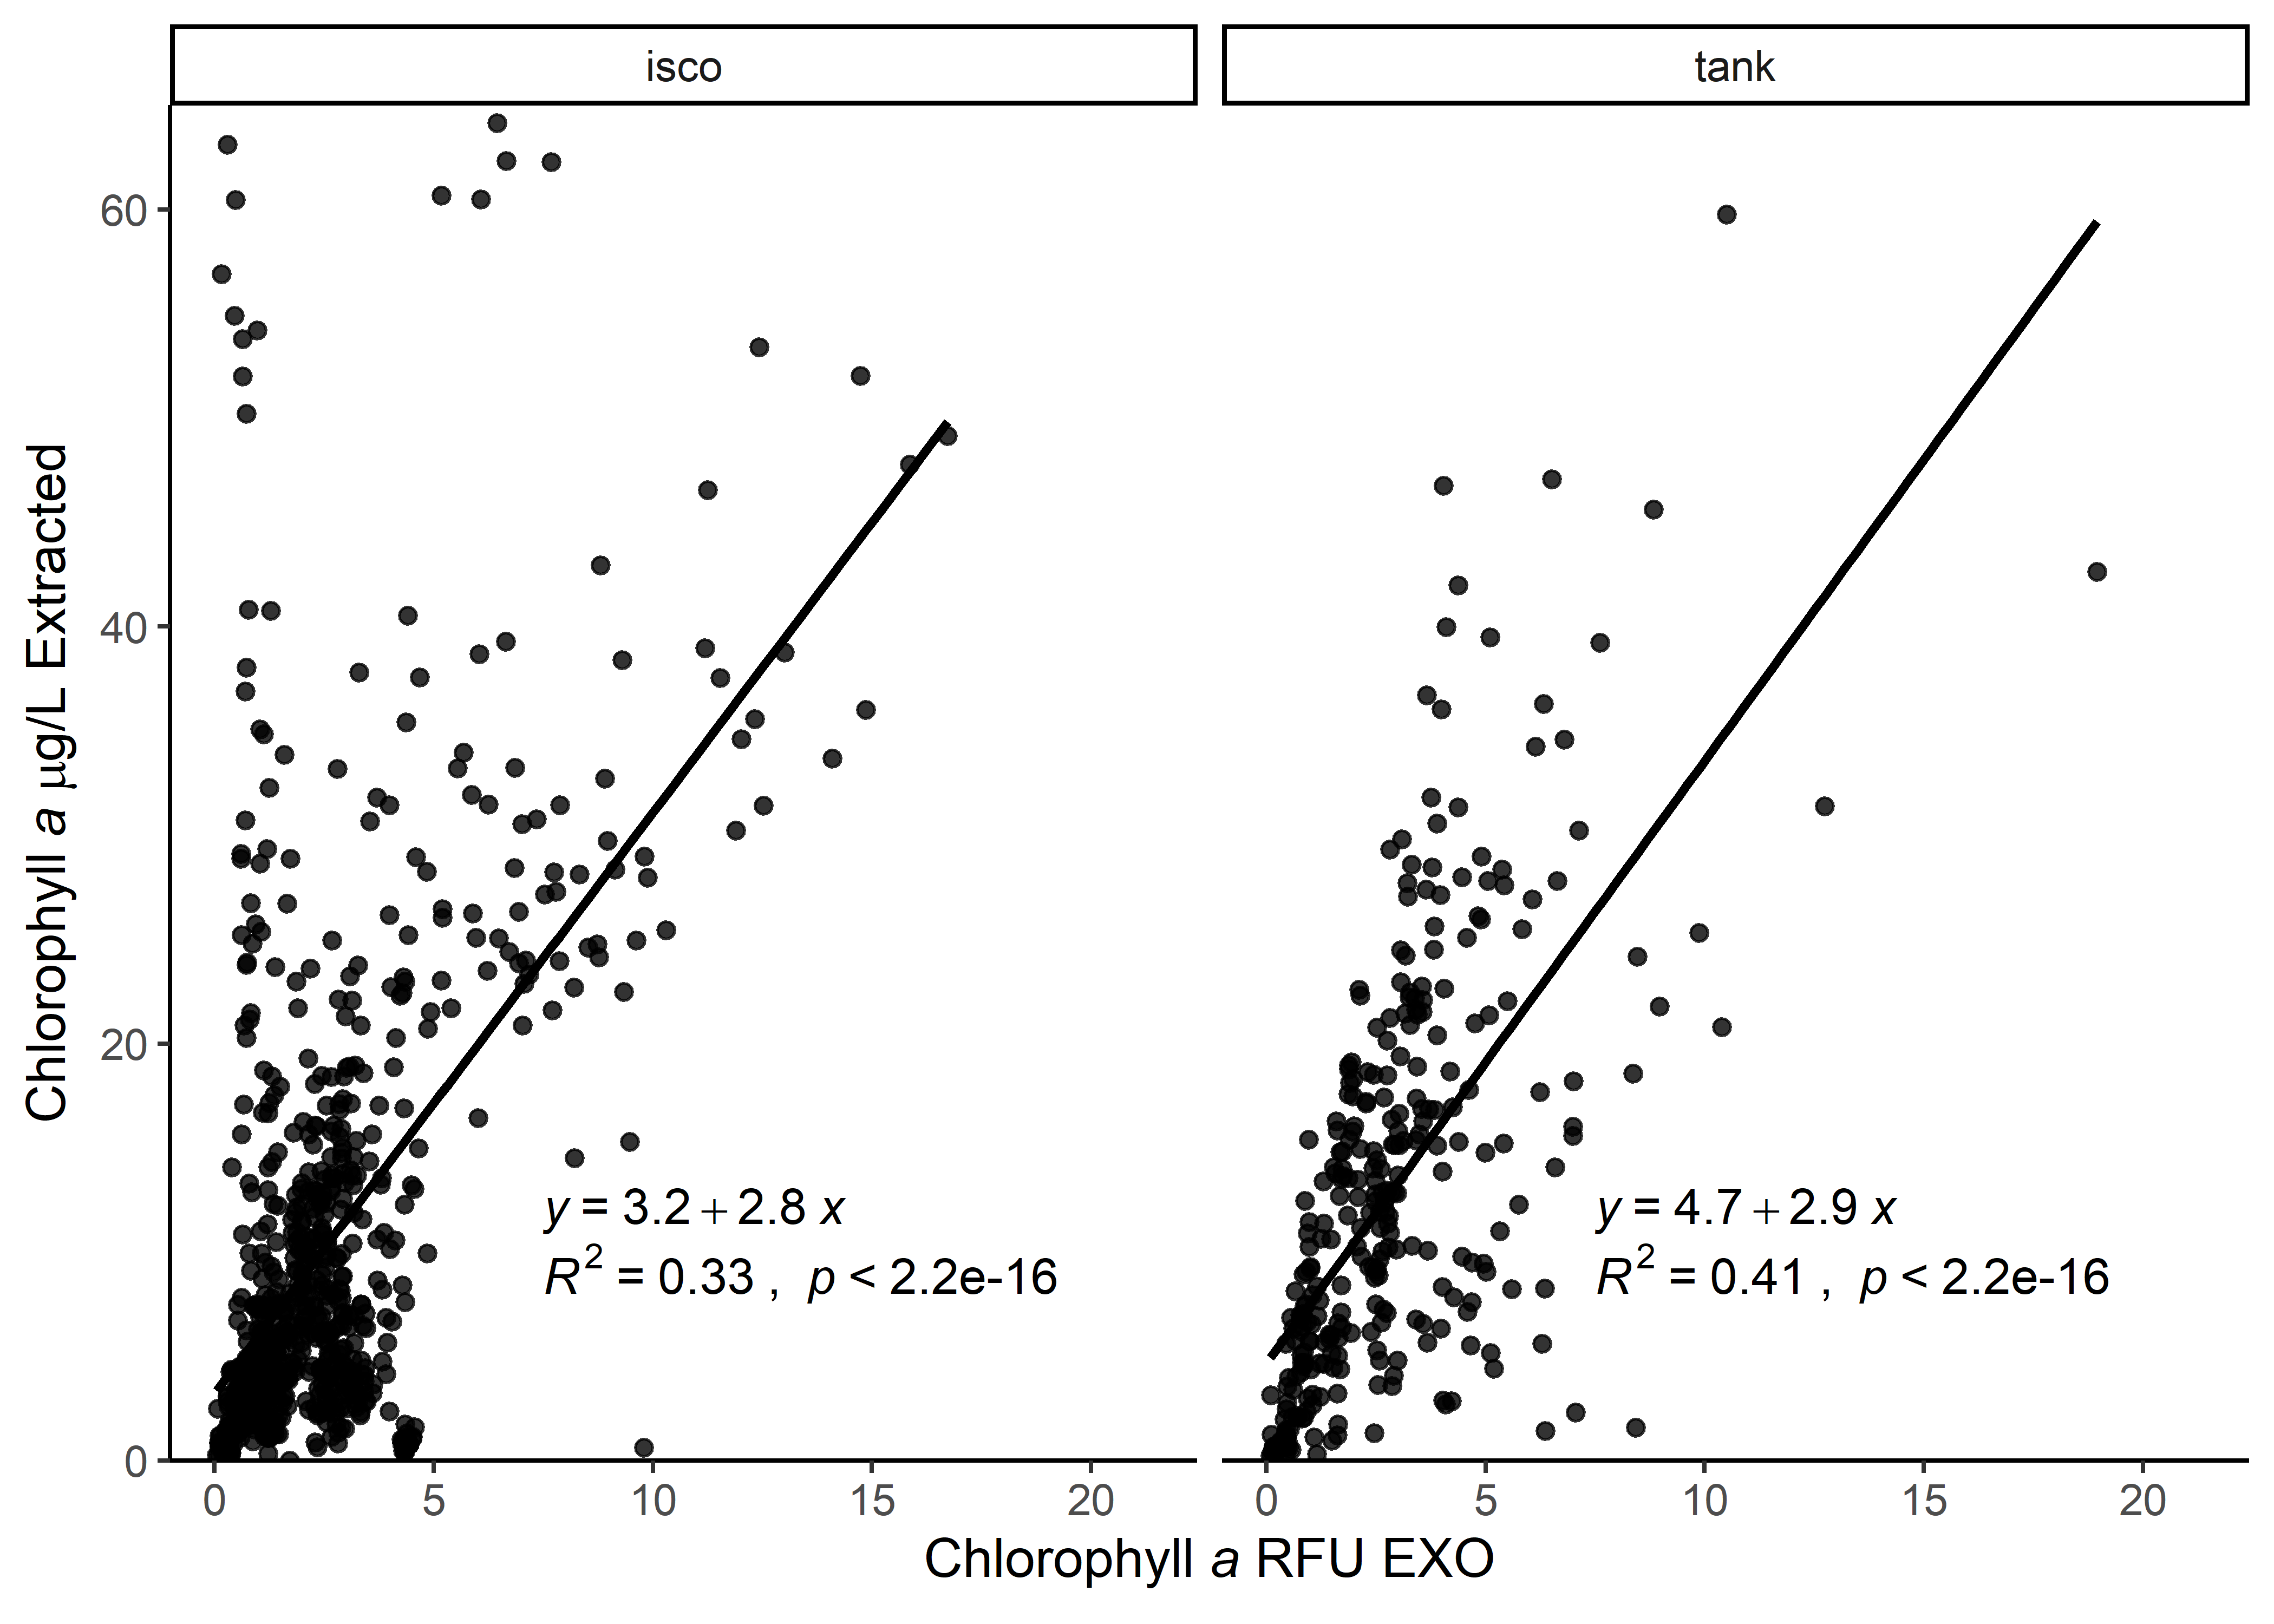
Tank vs ISCO
{-}
Summary Information
| Reserve | Extracted CHLA (ugL) | fDOM (QSU) | Salinity (psu) | Turbidity (FNU) | pH | CHLA (RFU) EXO | Temperature (C) | Dissolved Oxygen (mg/L) |
|---|---|---|---|---|---|---|---|---|
| ELK | 1.7-31.46 (10.88±7.34) | 1.57-32.58 (17.71±6.47) | 30.53-34.49 (33±1.02) | 1.94-33.27 (6.16±5.12) | 7.45-8.27 (7.91±0.16) | 0.29-9.62 (2.19±1.91) | 11.04-22.96 (16.56±3.71) | 4.14-11.46 (7.37±1.69) |
| GND | 1.73-31.43 (13.96±5.86) | 42.85-113.24 (79.46±20.17) | 7.28-16.68 (11.02±3.17) | 5.16-24.89 (12.21±6.29) | 7.09-7.95 (7.52±0.29) | 1.63-3.99 (2.63±0.49) | 27.24-30.08 (28.69±0.89) | 5.2-7.67 (6.66±0.83) |
| GRB | 0-84.45 (5.98±9.12) | 1.78-121.17 (48.94±42.53) | 0.06-30.12 (18.5±11) | 1.42-123.4 (8.31±12.67) | 7.35-9.13 (8.25±0.54) | 0.71-21.36 (1.86±1.95) | 17.49-28.07 (21.95±2.53) | 3.97-9.7 (7.37±1.5) |
| GTM | 0.42-42.63 (5.4±5.56) | 59.6-195.15 (122.02±32.22) | 0.1-25.68 (11.05±7.05) | 2.18-34.31 (8.05±4.91) | 6.55-8.04 (7.29±0.4) | 0.86-18.96 (3.5±2.11) | 14.55-32.53 (22.9±6.59) | 2.03-9.23 (5.98±1.73) |
| HEE | 0.01-3.62 (0.65±0.5) | 0.53-73.69 (16.17±21.29) | 0.12-34.93 (31.51±7.8) | 0.37-11.35 (2.78±2.19) | 6.95-8.61 (7.91±0.39) | 0.05-1.49 (0.32±0.27) | 20.92-29.5 (25.92±1.74) | 0.03-9.98 (6.45±1.48) |
| LKS | 2.42-92.01 (21.79±17.45) | 45.74-195.75 (105.29±46.62) | 0.08-0.14 (0.09±0.01) | 0.41-11.87 (7.16±2.3) | 7.34-8.71 (7.98±0.34) | 0.48-9.31 (3.01±1.53) | 10.2-24.49 (19.61±4.64) | 4.1-10.45 (8.45±1.6) |
| MAR | 3.4-36.71 (12.5±9.61) | 4.69-66.12 (15.46±14.88) | 6.93-35.05 (27.03±6.97) | 2.08-26.39 (7.27±6.51) | 7.88-8.08 (7.98±0.07) | 0.45-3.66 (1.28±0.96) | NA | NA |
| NIW | 1.96-62.28 (14.13±9.53) | 11.75-148.43 (67.46±30.83) | 1.29-40.91 (15.92±12.35) | 3.72-62.35 (17.22±10.34) | 6.82-7.51 (7.13±0.19) | 0.41-7.68 (2.15±1.07) | 27.31-29.91 (28.75±0.78) | 4.76-6.73 (5.75±0.57) |
| OWC | 0.63-62.33 (20.19±14.45) | 4.46-132.47 (61.61±34.12) | 0.13-0.31 (0.2±0.05) | 9.21-166.75 (28.36±18.81) | 6.94-8.04 (7.54±0.27) | 0.5-16.73 (4.68±4.22) | 0.02-26.3 (13.63±9.81) | 2.07-14.69 (8.93±3.67) |
| PDB | 0.56-19.3 (3.53±3.25) | 2.58-17.58 (7.93±3.32) | 17.53-30.47 (28.45±1.72) | 0.11-243.83 (6.25±23.74) | 7.66-8.69 (7.94±0.24) | 0.21-4.99 (0.84±0.77) | 3.62-18.19 (10.82±4.24) | 6.06-15.3 (9.51±1.71) |
| SAP | 1.1-45.61 (14.26±10.15) | 28.67-112.02 (62±25.55) | 17.83-28.97 (23.85±2.7) | 8.37-64.4 (20.58±11.74) | 7.24-7.93 (7.57±0.23) | 0.83-8.84 (4.09±2.01) | NA | NA |
| WEL | 0.21-68.6 (8.52±18.41) | 2.02-78.46 (15.94±16.97) | 26.68-32.22 (30.36±1.31) | 0.69-57.83 (4.63±7.47) | 7.34-8.19 (7.86±0.17) | 0.07-2.79 (0.67±0.62) | 1.23-23.6 (10.67±6.36) | 3.93-12.28 (9.13±1.68) |
Interference Parameters
These are the three parameters of interest in the interference testing studies. The following is the chlorophyll a fluorescence (RFU) from the EXO total algae sensor by the extracted \(\mu\)g/L with the three parameters of interest overlaid as color. Note: Data where the interference parameter (fDOM, turbidity, or temperature) is not available have been removed from the figures.
How to use the interactive plot: Hover over interactive plot for the tools panel to appear in top-right corner. Tools include: save plot, zoom, select (lasso or box), and data compare. Hover your cursor over a point for more information.
fDOM
Turbidity
Had to filter to remove turbidity values > 240 NTU due to an outlier.
Temperature

This work is licensed under a Creative Commons Attribution-ShareAlike 4.0 International License. And was created by Shannon Dunnigan | Shannon.Dunnigan@FloridaDEP.gov | skdunnigan