He’eia
All Data
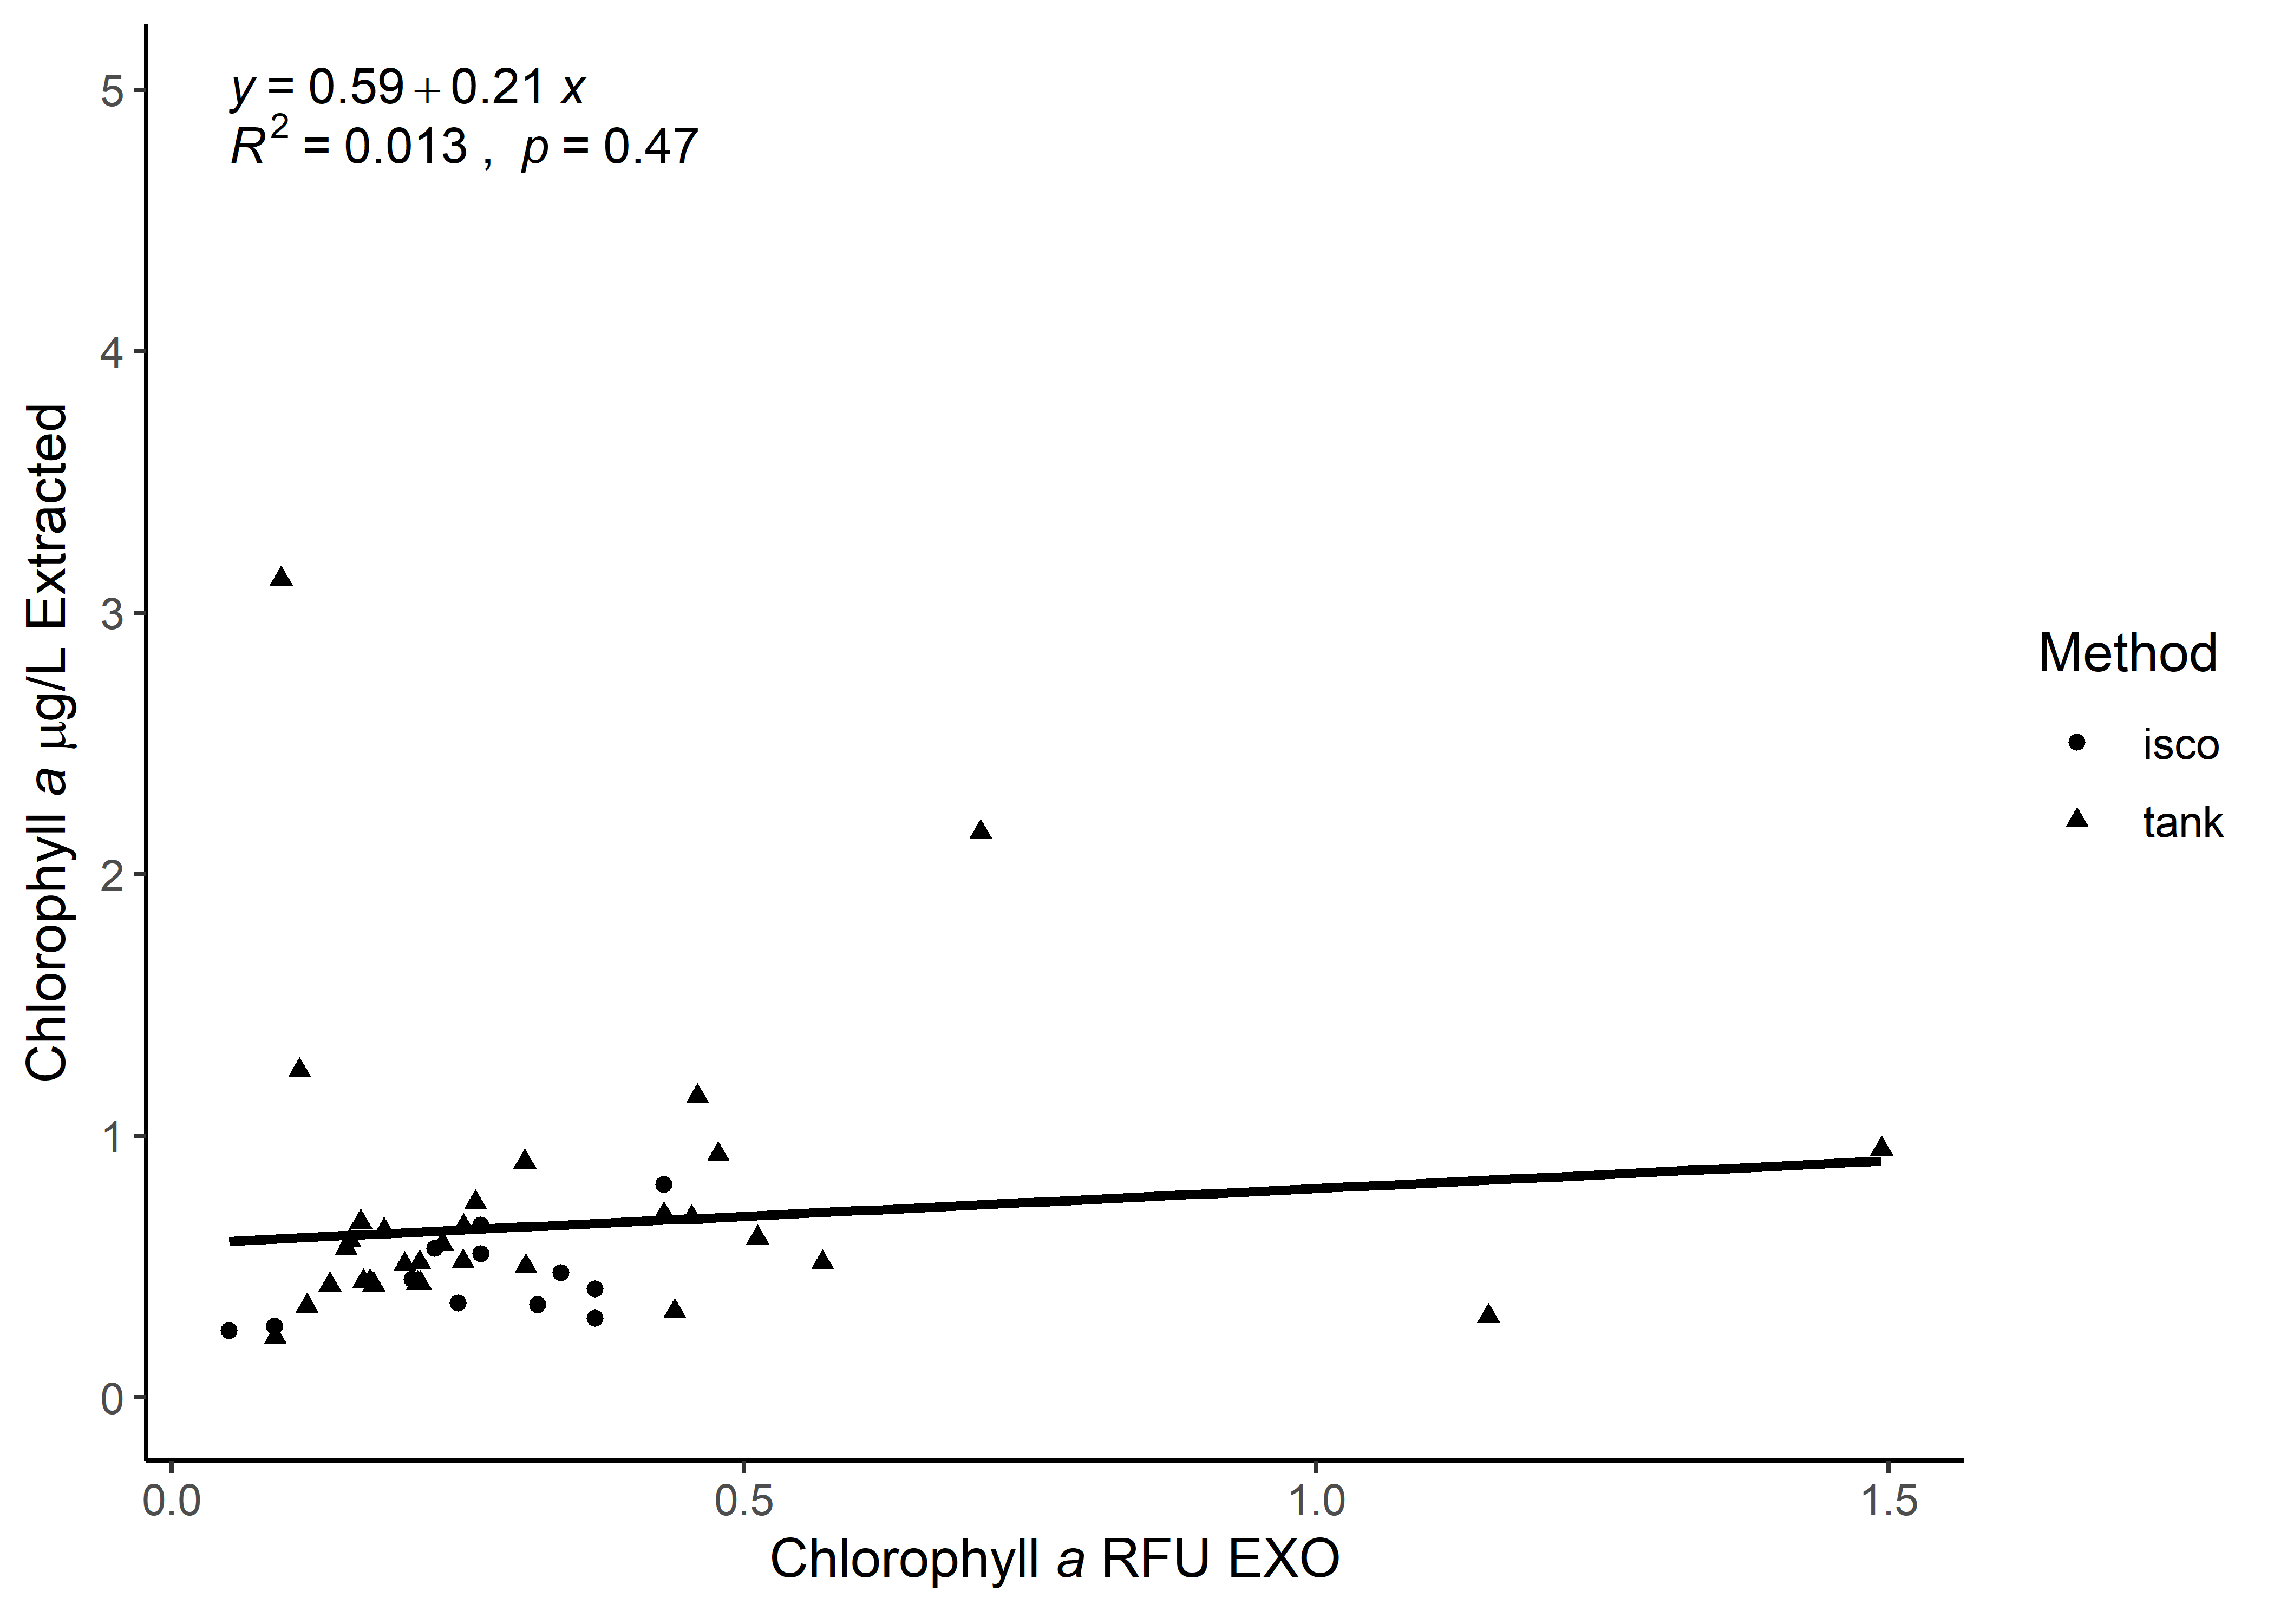
All
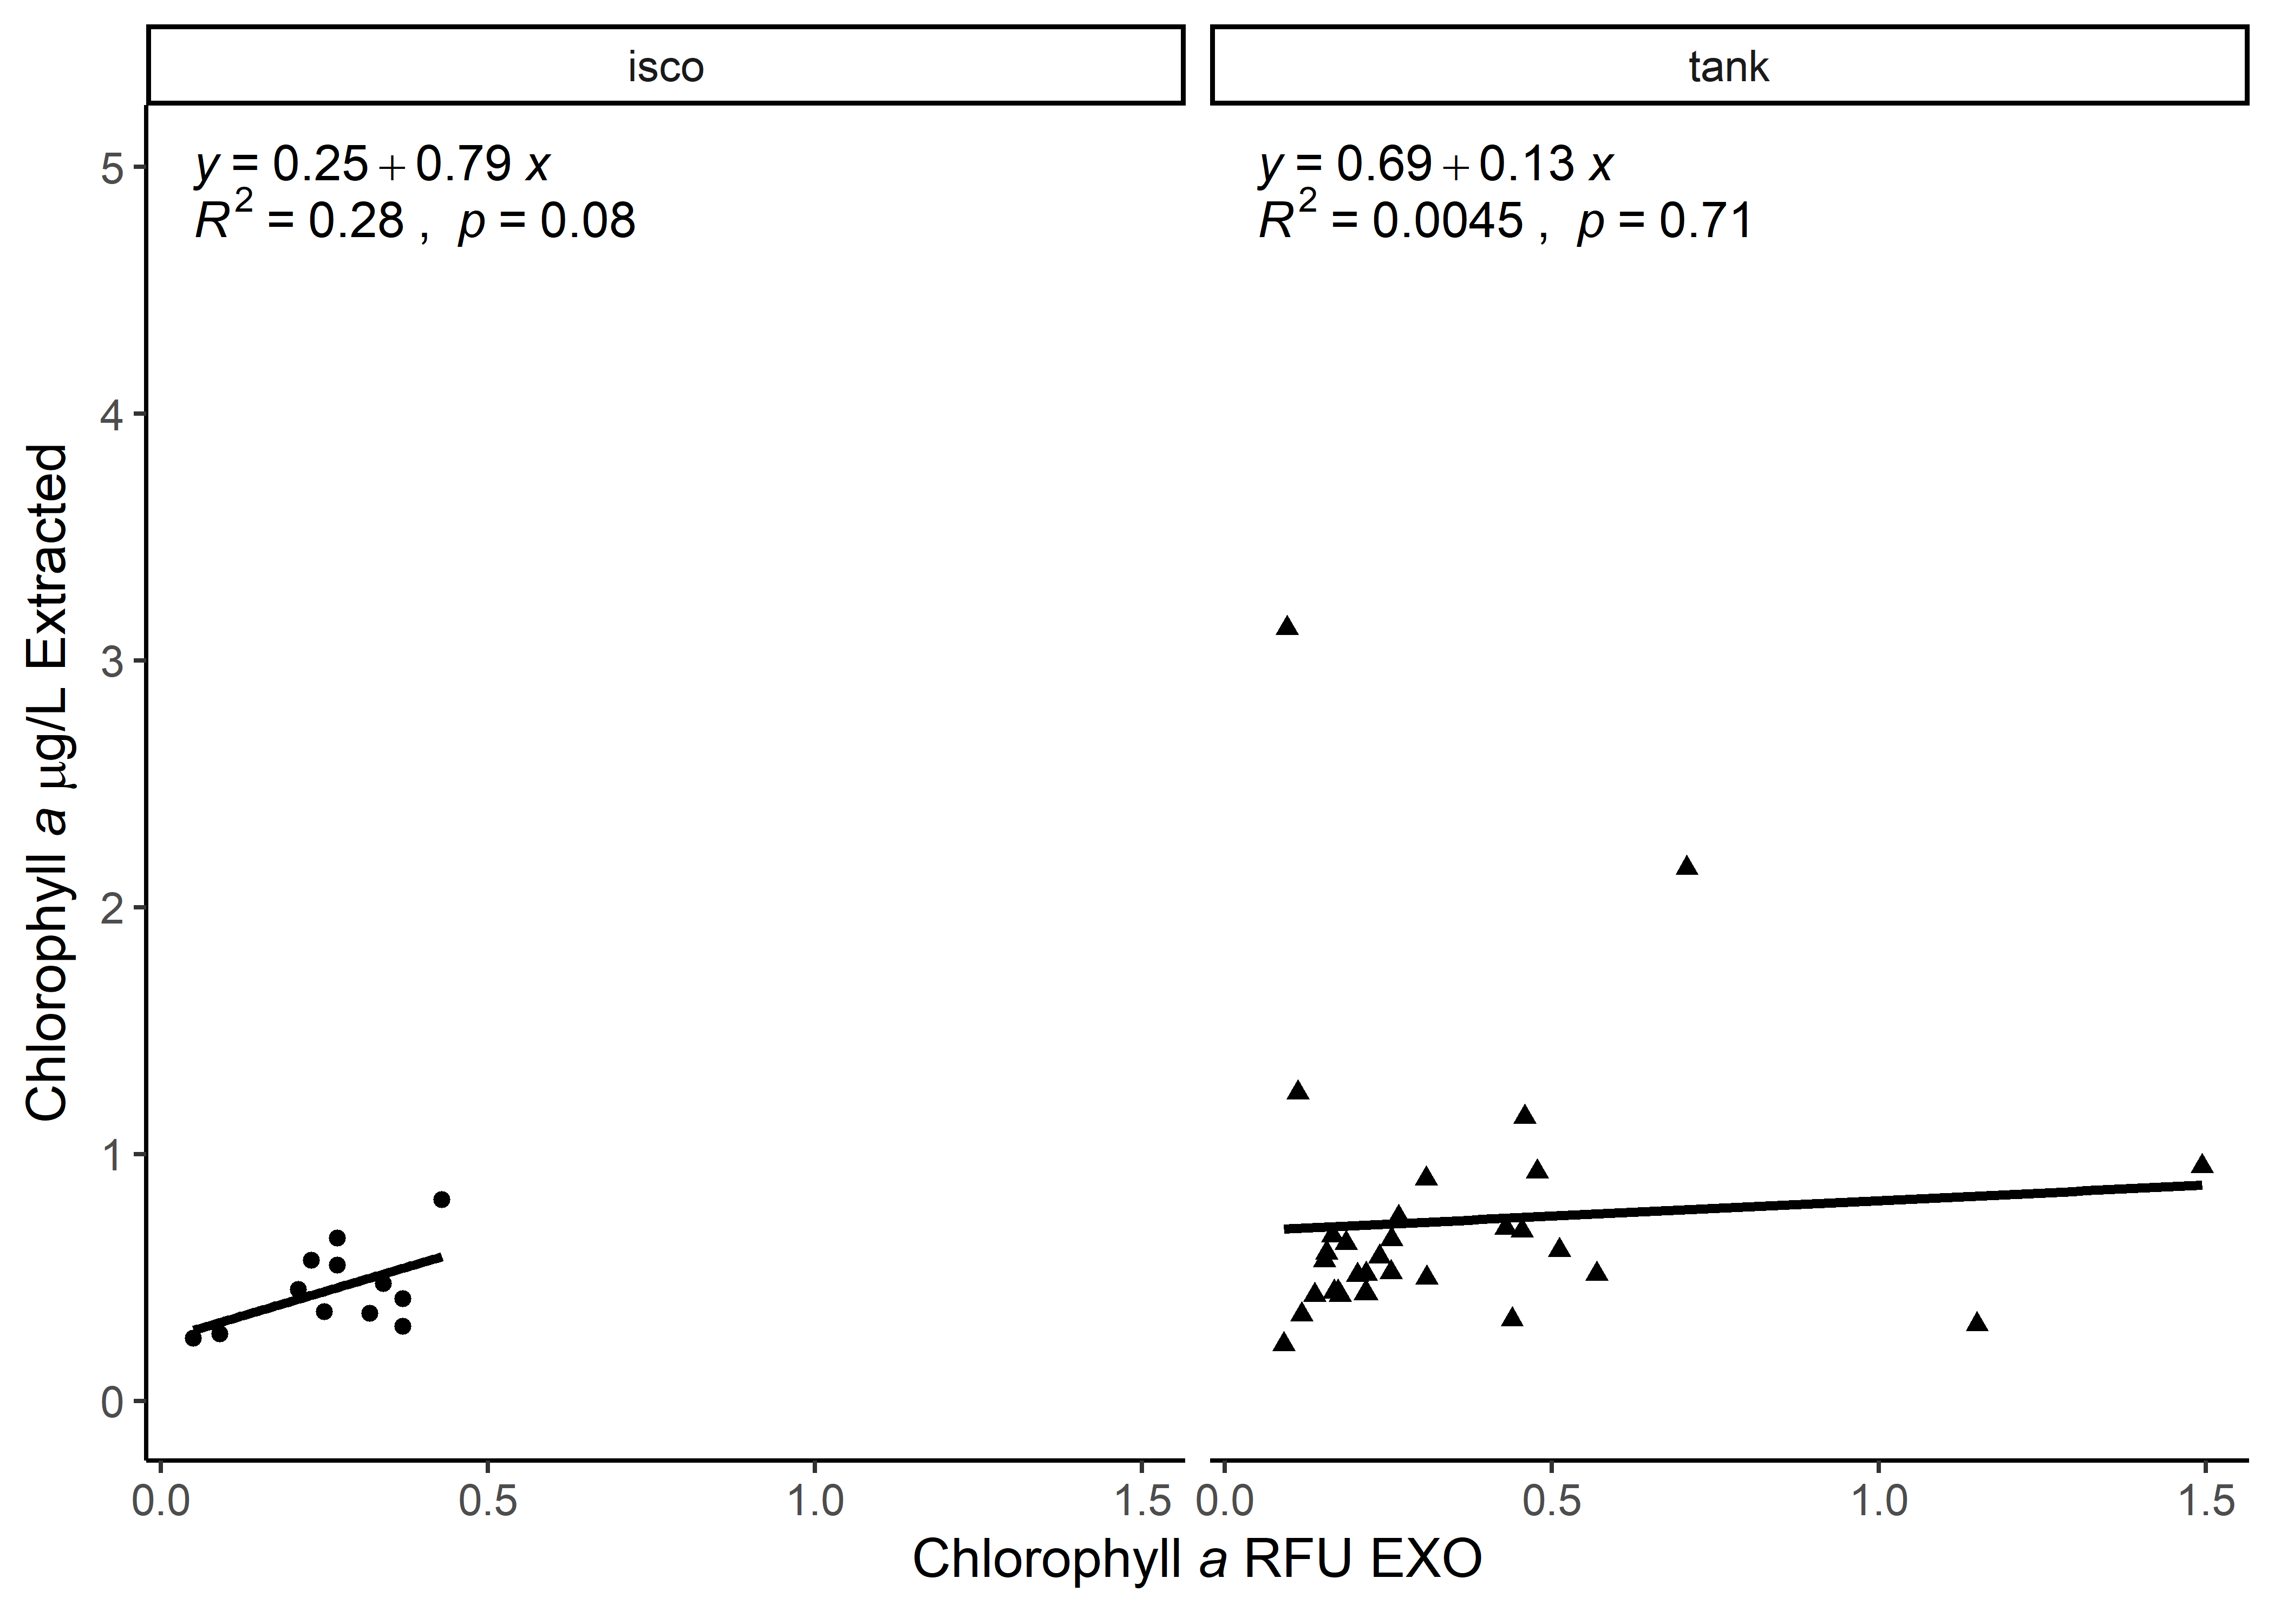
Facet by Methods
{-}
Interactive Plots for QAQC
How to use the interactive plot: Hover over interactive plot for the tools panel to appear in top-right corner. Tools include: save plot, zoom, select (lasso or box), and data compare. Hover your cursor over a point for more information. You can also double click on an item in the legend to isolate that data series in the plot!
ISCO Deployments
Tank Samples
Summary Tables
All Data
| parameter | n | mean | sd | median | trimmed | mad | min | max | range | skew | kurtosis | se |
|---|---|---|---|---|---|---|---|---|---|---|---|---|
| chla_ugl | 116 | 0.6523349 | 0.5025015 | 0.5300000 | 0.5625106 | 0.1667925 | 0.0083500 | 3.620000 | 3.611650 | 3.516313 | 15.041541 | 0.0466561 |
| chla_rfu | 0 | NaN | NA | NA | NaN | NA | Inf | -Inf | -Inf | NA | NA | NA |
| fdom_qsu | 32 | 16.1696657 | 21.2868607 | 9.2932784 | 11.5473410 | 8.5305120 | 0.5275056 | 73.690000 | 73.162494 | 1.913723 | 2.178503 | 3.7630209 |
| sal | 116 | 31.5073582 | 7.7988567 | 33.7850000 | 33.4793908 | 0.8969730 | 0.1200000 | 34.930000 | 34.810000 | -3.481940 | 10.676895 | 0.7241057 |
| turb | 116 | 2.7757897 | 2.1861920 | 2.3050000 | 2.3721019 | 1.4275096 | 0.3715158 | 11.350000 | 10.978484 | 2.027755 | 4.438514 | 0.2029828 |
| p_h | 116 | 7.9148609 | 0.3885308 | 8.0320083 | 7.9823120 | 0.1156305 | 6.9500000 | 8.610000 | 1.660000 | -1.703287 | 1.666821 | 0.0360742 |
| chlorophyll_rfu | 44 | 0.3205340 | 0.2652531 | 0.2522759 | 0.2738352 | 0.1367398 | 0.0500000 | 1.493892 | 1.443892 | 2.638712 | 8.119015 | 0.0399884 |
ISCO Data Only
| parameter | n | mean | sd | median | trimmed | mad | min | max | range | skew | kurtosis | se |
|---|---|---|---|---|---|---|---|---|---|---|---|---|
| chla_ugl | 84 | 0.6230815 | 0.4762307 | 0.5300 | 0.5446471 | 0.1593795 | 0.00835 | 3.62 | 3.61165 | 3.8163709 | 18.8149929 | 0.0519610 |
| chla_rfu | 0 | NaN | NA | NA | NaN | NA | Inf | -Inf | -Inf | NA | NA | NA |
| fdom_qsu | 0 | NaN | NA | NA | NaN | NA | Inf | -Inf | -Inf | NA | NA | NA |
| do_mgl | 84 | 6.4459524 | 1.4783238 | 6.4450 | 6.4604412 | 1.4900130 | 0.03000 | 9.98 | 9.95000 | -0.6777073 | 2.8069502 | 0.1612984 |
| sal | 84 | 32.6463095 | 5.7976316 | 33.9050 | 33.7775000 | 0.8969730 | 1.35000 | 34.93 | 33.58000 | -4.7545454 | 21.4988679 | 0.6325735 |
| turb | 84 | 3.0040476 | 1.6956508 | 2.7450 | 2.7639706 | 1.0748850 | 0.71000 | 11.35 | 10.64000 | 2.0658576 | 6.3233998 | 0.1850107 |
| temp | 84 | 25.9207976 | 1.7386004 | 26.0295 | 26.0276471 | 1.5923124 | 20.91900 | 29.50 | 8.58100 | -0.5533033 | 0.1346014 | 0.1896969 |
| p_h | 84 | 7.8965476 | 0.3968293 | 8.0100 | 7.9647059 | 0.1186080 | 6.95000 | 8.61 | 1.66000 | -1.6910138 | 1.5441783 | 0.0432976 |
| chlorophyll_rfu | 12 | 0.2666667 | 0.1125194 | 0.2700 | 0.2720000 | 0.0963690 | 0.05000 | 0.43 | 0.38000 | -0.5154146 | -0.8337020 | 0.0324815 |
Tank Data Only
| parameter | n | mean | sd | median | trimmed | mad | min | max | range | skew | kurtosis | se |
|---|---|---|---|---|---|---|---|---|---|---|---|---|
| chla_ugl | 32 | 0.7291250 | 0.5666476 | 0.5775000 | 0.6123846 | 0.2049694 | 0.2300000 | 3.130000 | 2.900000 | 2.830157 | 8.434396 | 0.1001701 |
| chla_rfu | 0 | NaN | NA | NA | NaN | NA | Inf | -Inf | -Inf | NA | NA | NA |
| fdom_qsu | 32 | 16.1696657 | 21.2868607 | 9.2932784 | 11.5473410 | 8.5305120 | 0.5275056 | 73.690000 | 73.162494 | 1.913723 | 2.178503 | 3.7630209 |
| sal | 32 | 28.5176111 | 11.0857485 | 33.1198982 | 31.0727513 | 2.0672555 | 0.1200000 | 34.917438 | 34.797438 | -2.027536 | 2.406257 | 1.9597020 |
| turb | 32 | 2.1766127 | 3.0854805 | 0.9949508 | 1.4366800 | 0.3676758 | 0.3715158 | 10.680000 | 10.308484 | 2.111410 | 2.691040 | 0.5454411 |
| p_h | 32 | 7.9629333 | 0.3675351 | 8.0738237 | 8.0233797 | 0.1165377 | 7.0041314 | 8.384133 | 1.380001 | -1.637063 | 1.514235 | 0.0649716 |
| chlorophyll_rfu | 32 | 0.3407342 | 0.3025857 | 0.2268275 | 0.2790406 | 0.1217111 | 0.0903371 | 1.493892 | 1.403555 | 2.287293 | 5.359797 | 0.0534901 |
Interactive Interference Parameters
These are the three parameters of interest in the interference testing studies. The following is the chlorophyll a fluorescence (RFU) from the EXO total algae sensor by the extracted \(\mu\)g/L with the three parameters of interest overlayed as color for the specific reserve of interest.
How to use the interactive plot: Hover over interactive plot for the tools panel to appear in top-right corner. Tools include: save plot, zoom, select (lasso or box), and data compare. Hover your cursor over a point for more information. You can also double click on an item in the legend to isolate that data series in the plot!
fDOM
Turbidity
Temperature

This work is licensed under a Creative Commons Attribution-ShareAlike 4.0 International License. And was created by Shannon Dunnigan | Shannon.Dunnigan@FloridaDEP.gov | skdunnigan